By Dr. Chris Curtin & Keisha-Rose Harrison of Oregon State University & Hannah Crum of Kombucha Brewers International & Kombucha Kamp
Thank you to everyone who participated in the first round of the KBI & Oregon State University Kombucha SCOBY DNA Sequencing study. With your help we sequenced nearly 100 samples provided by over 70 different companies from 26 states and 9 different countries around the world. The largest SCOBY DNA Sequencing Study to date! Previous studies that sought to improve our knowledge of SCOBY microbial populations have been more limited in scope. We now have more data points which can provide a clearer understanding of which microbes are common across commercial SCOBYs, and an opportunity to learn which strains may be responsible for different fermentation and flavour outcomes.
DNA Sequencing Analysis Process
For each sample received, we blended a standardized amount of SCOBY under controlled conditions, and then extracted the DNA from all microbes present in the sample. Regions of DNA that can be interpreted as ‘barcodes’ were amplified from each sample and sequenced using Illumina Miseq technology. The sequences of these ‘barcodes’ were compared to large databases of fungi and bacteria, and assigned to Operational Taxonomic Units (OTUs). In this study OTUs were defined at a standard cutoff of 97% similarity. In other words, if two ‘barcodes’ are only 96% similar in DNA sequence they would not be grouped into the same OTU.
Is an OTU representative of a species? Sometimes yes, but often no – within many genera (particularly for bacteria) individual species cannot be reliably differentiated using current DNA ‘barcodes’. This approach is highly robust when used to provide resolution at the genus level, meaning that all OTUs for one type of organisms are grouped together. For example, if a SCOBY contained both Lactobacillus casei and Lactobacillus plantarum their DNA ‘barcodes’ would be grouped together as Lactobacillus.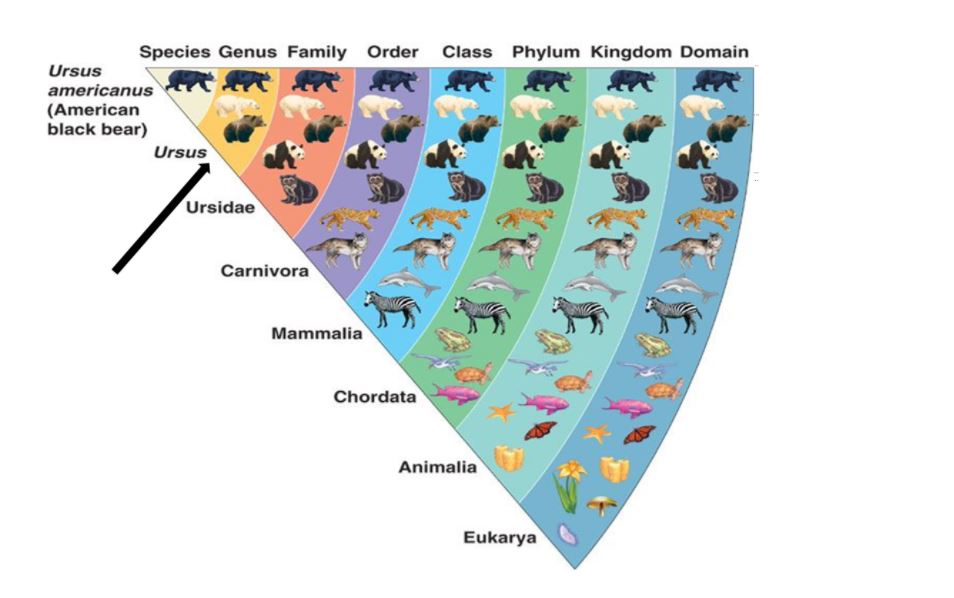
After the samples are matched at the genus level, each ‘barcode’ detected is counted to provide the frequency with which it appears in the sample to determine the proportion at which each genus of the whole bacterial or fungal population exists. These are the numbers of the sample represented as as follows: Dekkera 0.67 means that 67% of the fungal population in your sample belongs to the Dekkera genus.
Interpreting Your Results
Each sequencing report provided participants the bacteria and fungi profile of the sampled SCOBY. Below is an example of a report of bacteria detected. The genus level is read as “g_GENUS”. The number provided indicates how much of bacteria was present in the sample. For instance, 94.8% of this example sample is Gluconoacetobacter. Some other OTU groupings could not be reliably defined at genus level, in which case they will be named at family level but assigned as ‘Other’ or ‘g__’ at genus level. In this example, 2.7% of the bacterial population is made up of bacteria within family Acetobacteraceae that could not be assigned to a genus.
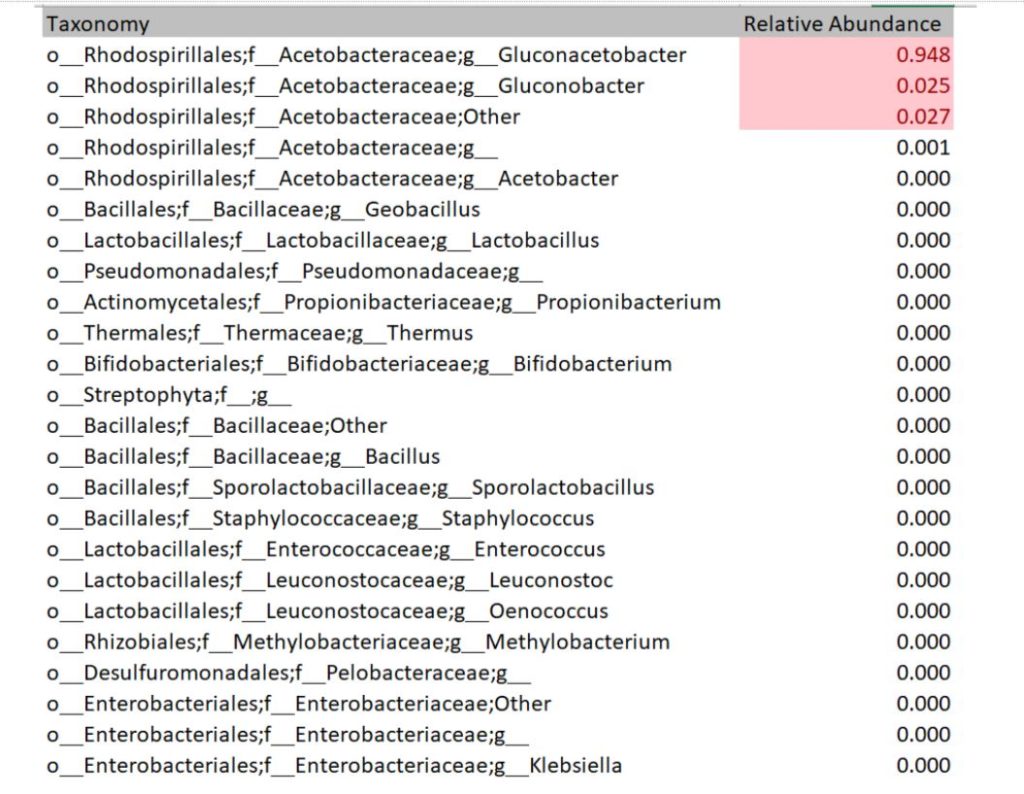
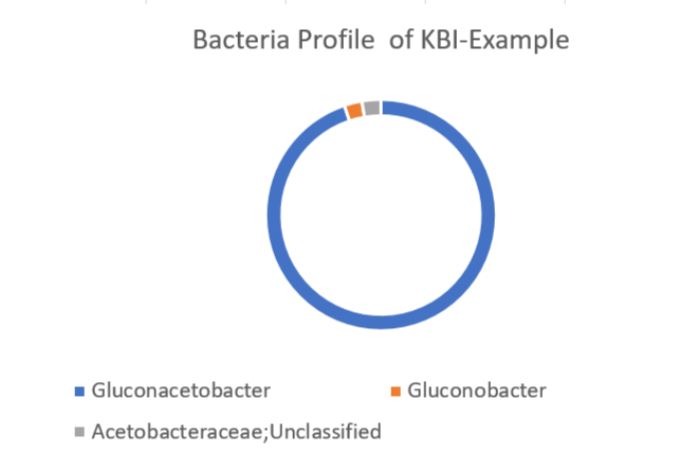
Using the values provided we can create a visual of the bacteria composition.
Please note that the taxonomic name of organisms can change. For example, Dekkera is now known only as Brettanomyces (previously the names were interchangeable), while Gluconoacteobacter xylinum and Acetobacter xylinum have been reassigned to Komagataeibacter xylinum. We’re sorry, but this is just as confusing for seasoned microbiologists!
Q: “My report says “unknown” for some of the organisms. What does that mean?”
A: Sometimes ‘barcodes’ are not able to be definitely assigned at the genus level due to a lack of resolution or because the sample may contain a species that has not yet been identified by the microbiology community. These OTUs are then grouped at the family level and genus may be given as ‘undefined’, ‘unknown’ or ‘other’.
How do your results compare to the “average” SCOBY
Each company received an individual report listing the respective percentages of each type of bacteria and yeast found in their sample.
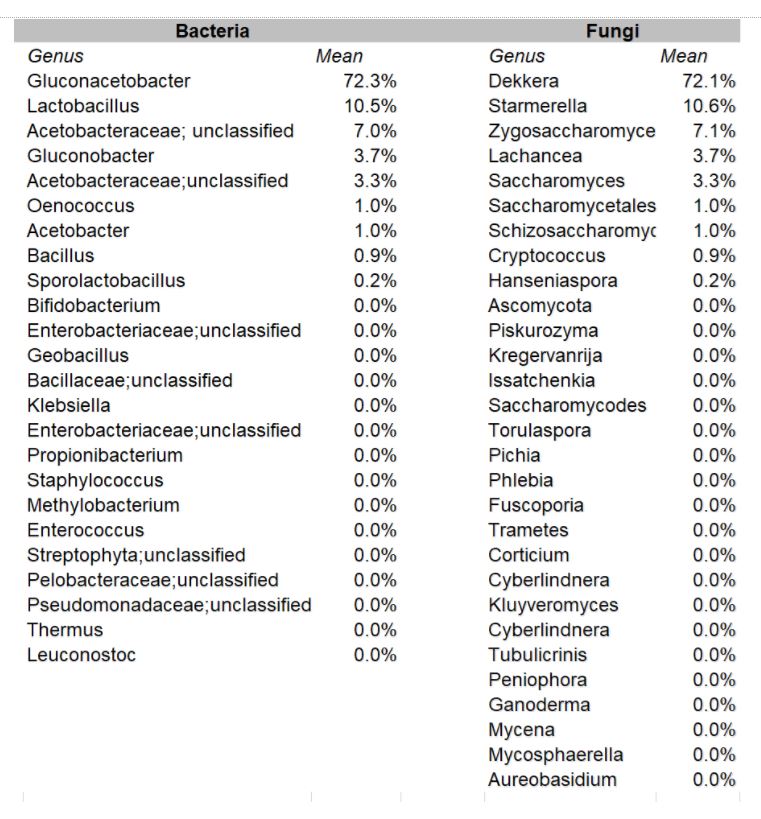
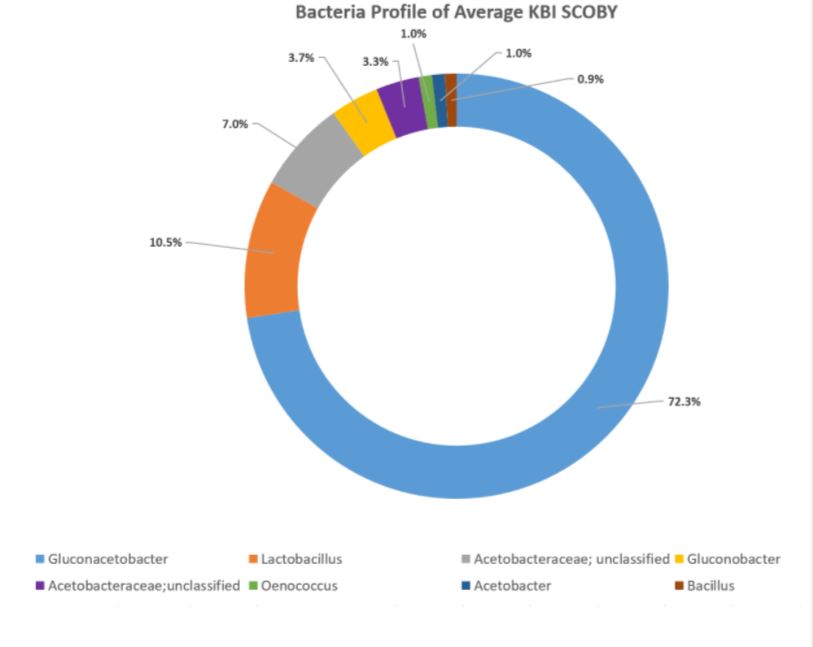
In the aggregate, it was found that the organisms occurred in these relative percentages:
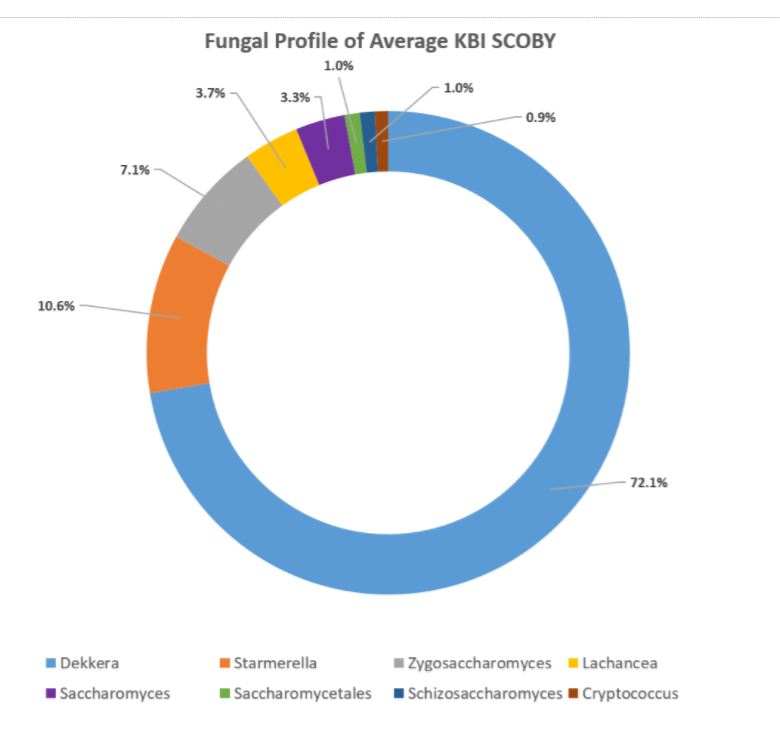
Making Sense of the Study
DOMINANT YEAST AND BACTERIA
As presented at KombuchaKon18, results from the study confirm that there is variability in SCOBY samples collected from different brewers. However we were able to identify core microbes that are present in most SCOBYs. On average, the most common fungi were Brettanomyces/Dekkera and Starmerella, while the most common bacteria were Gluconacetobacter, Gluconobacter, and Lactobacillus.
The near constant fluctuation of organism name changes presents its own kind of challenge. In previous SCOBY & Kombucha DNA Sequencing studies, for example, there are no instances of Starmerella being detected, however, when doing cursory research, it turns out this is a newer nomenclature for many species that used to be known as different types of Candida spp. which have been identified in other studies. However, without going to the species level, it is difficult to ascertain which stains correspond to those found in previous studies versus which may be novel to Kombucha.
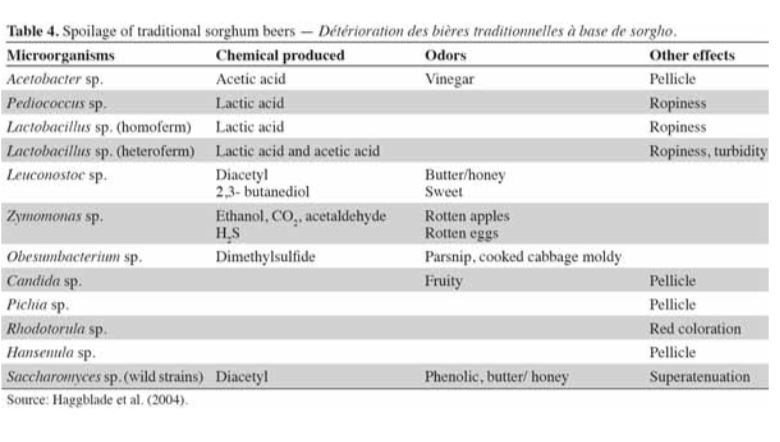
HOW DOES THIS INFLUENCE FLAVOR AND FERMENTATION?
Identifying the prevalent organisms within the SCOBY is the first step towards answering this question. We do know that different types of yeast convert sugar to alcohol at different rates. It is also known that different types of bacteria produce varying kinds of organic acids in similar fermentation models, i.e. beer, wine (see table below). There is likely some overlap in how these microbes influence kombucha.
For the next study, we aim to determine how different microbial profiles influence your finished raw product. Continued participation in these studies will go a long way to addressing these questions.
In the meantime, some of the organisms found in Kombucha are also found in wine & beer. Here are some links to charts that outline the flavor profile and characteristics of some of those organisms.
Our yeast and bacteria are considered spoilage for beer & wine!
ARE SCOBYs MORE VARIABLE IN THEIR BACTERIA OR YEAST POPULATIONS?
On the whole, there seems to be more variability in the bacteria profiles of SCOBY samples. Bacteria are responsible for converting most of the ethanol into organic acids and for building the SCOBY. We will continue to study how different types of bacteria influence the secondary fermentation.
VARIATION BETWEEN SCOBY AND STARTER FLUID MICROBIAL POPULATIONS
For this study we only examined the SCOBY and not the starter fluid. For the second sequencing study we will look at both! As mentioned in the presentation at Kombuchakon, acetic acid bacteria build the the SCOBY. They do not have to live in the SCOBY to produce acids (e.g. vinegar is made without a SCOBY), just as yeast do not have to live in the SCOBY to degrade sugars. The SCOBY does, however, enable repeated fermentations to be started with multiple species present, something that would be difficult to achieve otherwise. The SCOBY effectively buffers microbes against what would otherwise be a fluctuating environment as the sweet tea goes through alcoholic fermentation and acetification. .
METADATA ANALYSIS
At the time of sample collection, a couple of questions were asked in order to analyze the data according to a couple of variables – namely age of the culture sampled and location. We then sent out a follow up survey for additional metadata including age of the culture sampled, type & quantity of tea; type & quantity of sugar; and batch size to see if the data would show any trends or patterns based on these variables. Not all participants answered this part of the survey and we hope to have a more thorough Metadata Analysis available in future studies. This will greatly enhance the applicability of study results to the KBI community.
REGIONAL VARIATION
Preliminary analyses suggest there may be some region-to-region variances in the bacteria and fungal composition of the SCOBY, though it should be noted that sample numbers and the amount of metadata provided were uneven. Future studies will request additional metadata in order to determine the influence of types & quantities of tea, sugar and other variables.
NEXT STEPS
KBI & OSU will be partnering on a new DNA sequencing study and will also be conducting an analyte study. We hope to receive at least as many samples as last time if not more so that our knowledge base will continue to deepen. Stay tuned for more details coming soon!