KBI/OSU Genomic Study
A Summary of Kombucha Microbiome Research

By Keisha Rose Harrison

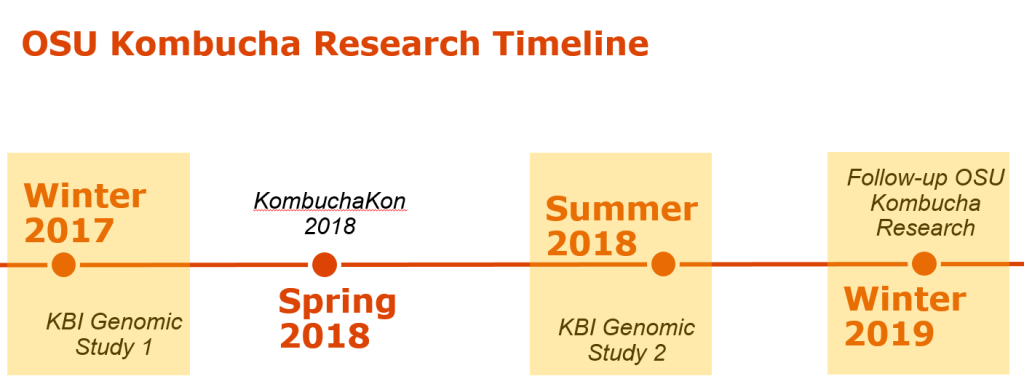
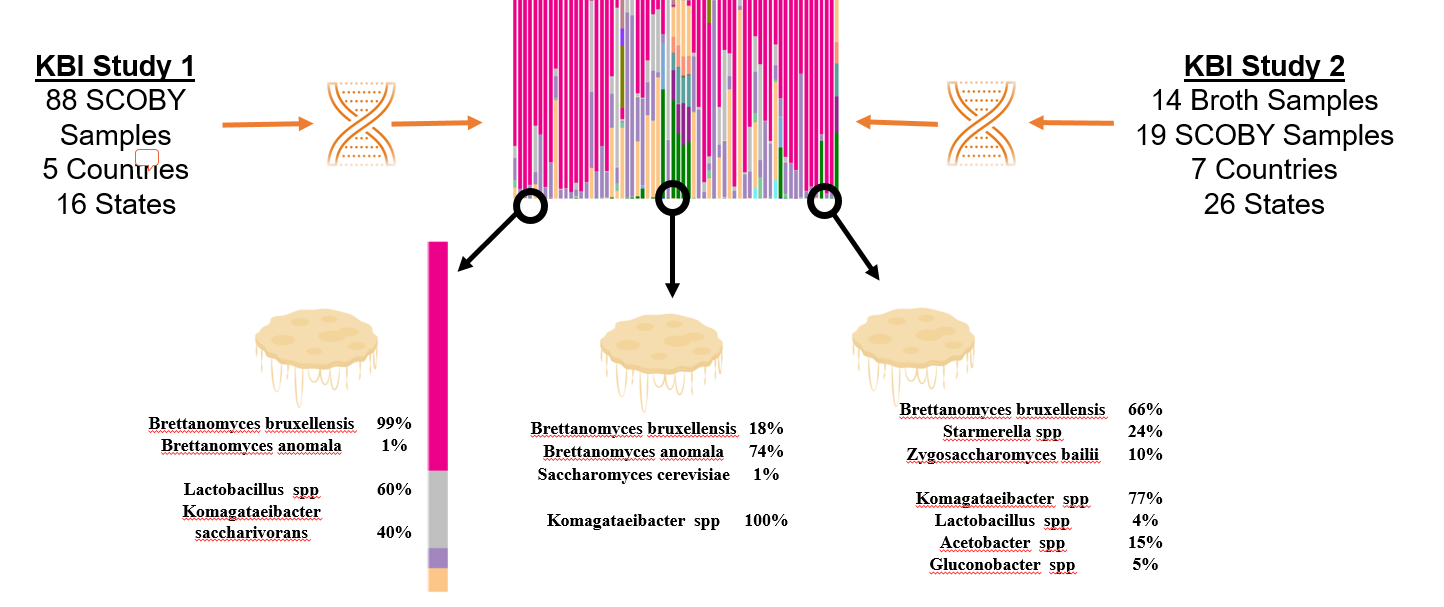
The KBI/OSU SCOBY Genomic Study took place from November 2017 to September 2018 as a two-part study. Part 1 asked the questions “what does the Kombucha SCOBY consist of?” and “how diverse is the Kombucha SCOBY?” in regards to the collective microbiota (the bacterial and fungal populations). Participants were asked to submit representative samples from a SCOBY (solid starter culture) with information regarding current location and time of use.

Part 2 was designed as a follow-up study to ask more specific questions about Kombucha starter cultures and brewing practices. Participants were asked in the Part 2 study to submit either broth (liquid starter culture) or SCOBY samples and to answer a questionnaire about brewing practices (including tea type and brewing volume). Data collected from both studies were combined to strengthen the scope of the study and conclusions about microbiota patterns. A total of 107 SCOBY and 19 Broth samples were collected and evaluated from 7 countries and 26 US states.

SIGN UP TODAY FOR KEISHA’S WEBINAR – JULY 31st 1pm PST 

timeline of KBI OSU SCOBY genomics study


Before diving into the results, let’s review the study methods and approach. Both parts relied upon the same DNA sequencing technique to determine microbiota from sample submissions. DNA was extracted using a method modified from traditional column-based extraction protocols. Measures were used to ensure that samples were thoroughly mixed to best represent the sample. Amplicon sequencing was the method of DNA sequencing. During this process, conserved regions of bacterial rDNA and fungal DNA were amplified and sequenced using fluorescent markers.

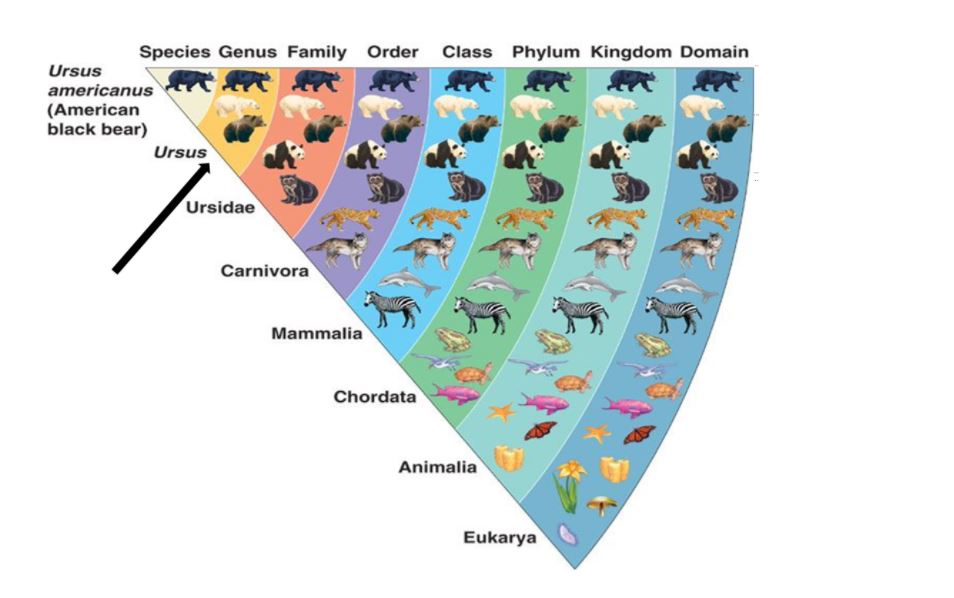
What exactly does that mean? Each bacterial and fungal cell has a “fingerprint” in its DNA that is generally conserved among members of a genus and species. It is this “fingerprint” that is copied and read. A bioinformatics pipeline is subsequently used to assign species-level identification for yeast and genus-level identification for bacteria. Relative abundance is determined as the number of times a copy of the “fingerprint” is recognized in proportion to all of the fingerprints. Bacterial and fungal relative abundances are reported separately.

results of DNA sequencing of SCOBYs


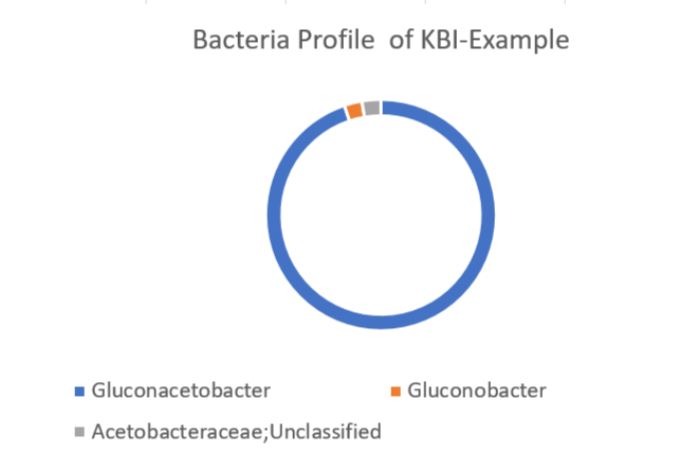
How to interpret your report? Participants received a report that included the participant ID (number used to ensure confidentiality), a list of bacteria genera with relative abundance, and a list of yeast species with relative abundance. An example of a “bacterial profile” report is depicted below. From this report, we can observe the composition of the bacterial population from a submitted sample. Only bacteria that were present at >0.01% were included in the report.  A majority, 43.7%, of the bacterial population in the sample was identified as Lactobacillus genus. The method of interpretation can be used for the fungal or yeast reports.

Bacteria (Genus) K-XXX
Sporolactobacillus 0.0700
Lactobacillus 0.4367
Oenococcus 0.1133
Acetobacter 0.1033
Gluconacetobacter 0.2767


Now that the relative abundance of bacteria and yeast are known, the next question is “so what does this mean?” What does a percentage tell us about the fermentation, taste, and quality of kombucha? On an individual level, each sample can serve as a building block of knowledge. Any quality assurance and control plan begins with a detailed overview of the system. Troubleshooting and monitoring starter culture health are all contingent upon knowing the composition of a “normal” and “healthy” culture. The impact of this research is strengthened when we zoom out and look at the whole sample population.

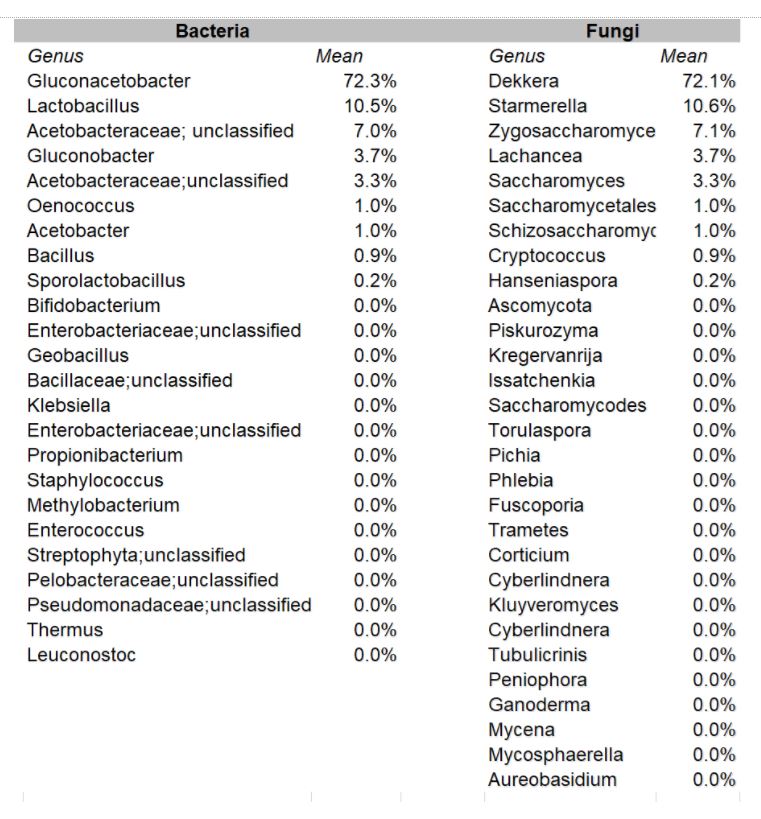
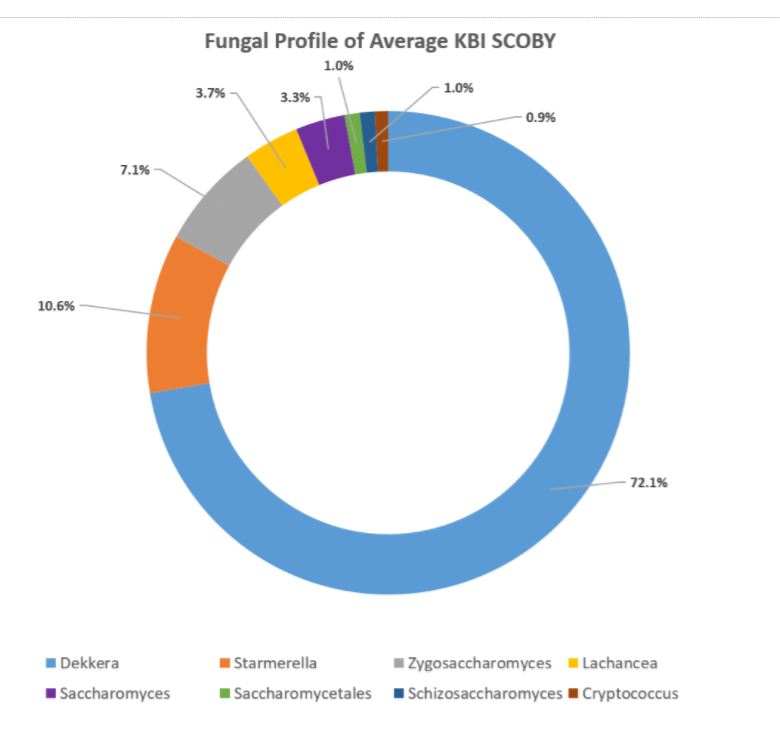
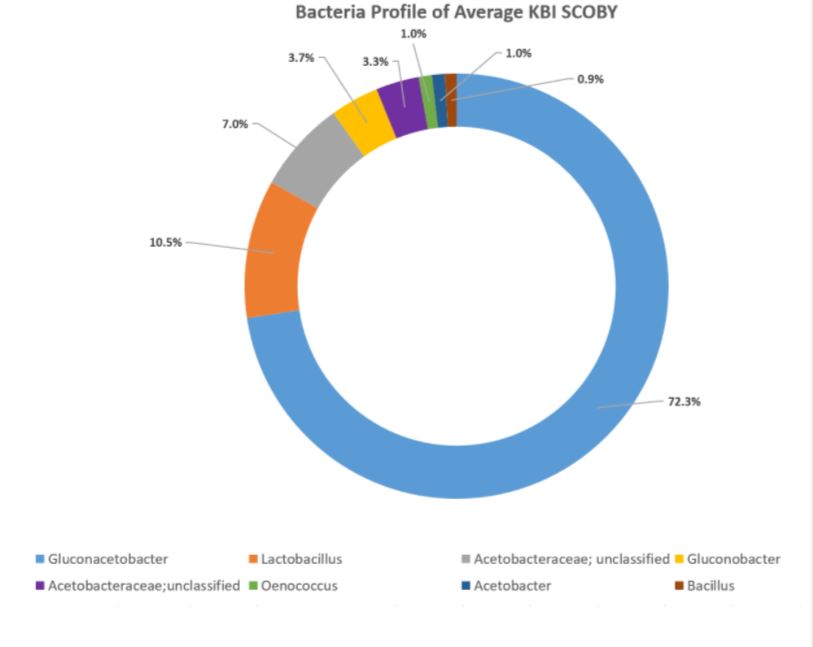
What does the data from both Part 1 and Part 2 tell us? By looking at the microbiota of multiple samples from various geographic locations, we began to answer questions about starter culture diversity. With the information provided by study participants were able to identify the most abundant Kombucha microorganisms, determine the impact of location and culture conditions on the microbiota, and classify starter culture “types”. Samples were collected from both solid and liquid starter cultures have the same common bacteria and yeast populations. Regardless of source, the most common yeast species (based upon an average of relative abundance) are Brettanomyces bruxellensis, Brettanomyces anomala, and Issatchenkia orientalis. The most common bacterial genera are Lactobacillus, Komagtaebacter, and Acetobacter. The proportions of bacteria genera vary depending upon starter culture source so that lactic acid bacteria is more abundant on average in broth than the SCOBY pellicle. Respectively, more acetic acid bacteria is abundant on average in the SCOBY pellicle than the broth. This makes sense we consider that the bacterial species, Komagaetibacter xylnium, is often credited with the formation of the physical SCOBY structure.

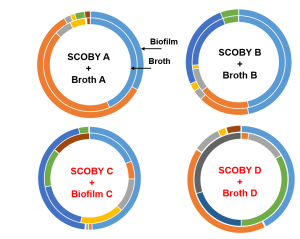
Taking a step back, let’s consider what this means. More of the bacteria type that produces ethanol, lactic acid, and carbon dioxide are on average found in broth. Whereas, more of the bacteria type that oxidizes ethanol and produces acetic acid is found in SCOBY. This diversity may be in part because of how the floating physical structure creates an air-liquid interface to support an oxygen-rich environment. Furthermore, we compared physical and liquid samples from the same producer to better understand the dynamic.

Let’s breakdown the figure below. The outside ring represents the SCOBY microbiota and the inside represents the BROTH microbiota. The color blocks represent top 5 microbial groups (so the most abundant bacteria and yeast genera). Blocks of the same color depict the same microbial group. The size of the block correlates the amount of that microbial group present. From the figure, we are comparing 4 BROTH and 4 SCOBY samples each BROTH/SCOBY pair is from the same location. The figure illustrates that in some instances the microbiota is comparable between SCOBY and BROTH and in some instances they differ. What does this mean? We cannot assume that the BROTH and SCOBY are interchangeable.

biofilm vs broth comparison of microorganisms composition

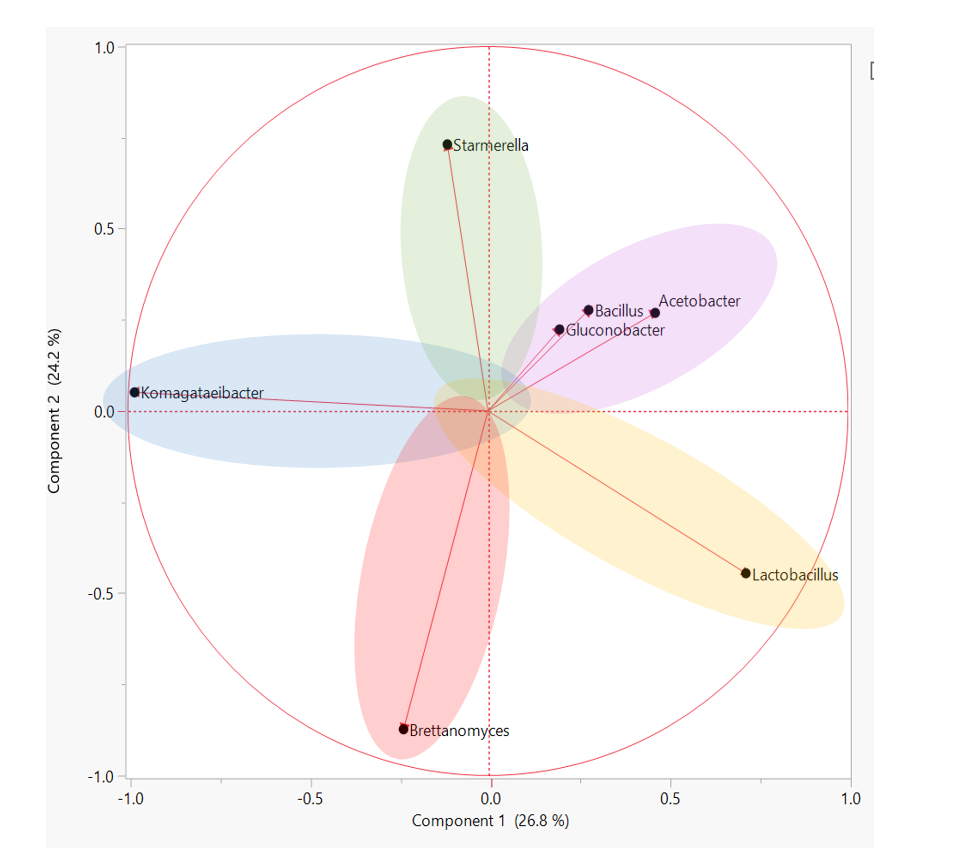
How to best understand ALL of this data? SCOBY sequencing revealed that there are many, many, MANY different species of yeast and bacteria in the Kombucha starter culture population. Looking at just the average SCOBY or BROTH composition is not representative of most individual samples and underscores the importance of starter culture diversity. A better way to compare starter cultures of rich diversity is to group similar microbiota profiles. In other words, by clustering samples that have similar amounts of Bacteria A and Yeast B, we are able to determine “types” of starter cultures. We ultimately used a hierarchical clustering analysis approach to sort through individual data and identify 5 groups within the overall population. These groups represent patterns of yeast and bacteria that any individual samples may fall under. The figure below depicts how specific types of microorganism are likely to appear together in a starter culture. Starter cultures with a large amount of the yeast genera, Brettanomyces, are less likely to be present in a culture with Starmerella/Candida. The “types” of starter culture can be described as follows:

[table id=8 /]

To determine how each starter culture type influences fermentation parameters, a preliminary study was undertaken in Dr. Chris Curtin’s lab at Oregon State University. Those findings will be available later in the year in the form of an academic publication that will be shared on the KBI site.

5 types of scobys

READ PART TWO OF THE STUDY

Webinar Wednesdays: DNA & Analyte Sequencing Study #2 Results
DATE: 2/20/19 1 pm on Zoom
WHO: Keisha Harrison & Dr. Chris Curtin
COST: Free for DNA/Analyte study participants, $20 KBI Non-Members

WEBINAR SUMMARY:  As part of the KBI-Oregon State University Genomic and Analyte Study [Summer 2018], Keisha Rose Harrison will be hosting a webinar review to summarize the study results and Kombucha fermentation science. What was the objective of the study? OSU is interesting in characterizing the diverse microecology of the commercial Kombucha SCOBY and the chemical composition of Kombucha tea. The flavor attributes and alcohol produced during the process are governed by the starter colony, a symbiotic culture of bacteria and yeast (SCOBY). The limited information about the composition of the Kombucha culture and the components of the end product make it cumbersome for producers to quantitatively troubleshoot. In the conventional brewing approach, there is no identification of inoculating cultures nor monitoring of culture consistency. Through this study we aim to identify common ecological and metabolic markers. 

WEBINAR TAKEAWAY: What will be gained from the webinar? Study participants will get an overview on how to best interpret their results. Group results will be presented in a meaningful way as to illustrate main ecological drivers and potential sources of divergence. Additionally, there will be a larger discussion on how the results may direct quantitative approaches to troubleshooting in production. Note, specific brewing questions that do not pertain to the study will not addressed.


ABOUT THE WEBINAR HOSTS

Keisha Harrison, M.S., is a PhD candidate of Fermentation Science in the Food Science & Technology Department at Oregon State University (OSU). She received a Bachelor of Arts in Cell Biology and Biochemistry from Rice University and a Master of Science in Nutrition from the University of Houston. Keisha was drawn to Kombucha research because it is a beautifully complex system to study microbial interactions. She aims to understand the links between the microbial landscape of the Kombucha SCOBY and the sensory experience. She believes to get at the heart of Kombucha, we have to get better acquainted with it first!


Chris Curtin, Ph.D. is an Assistant Professor in the Food Science & Technology Department at Oregon State University (OSU). Prior to joining OSU in 2016 he lead the Biosciences research group at the Australian Wine Research Institute, where he was responsible for development of yeast strains and development of strategies to mitigate spoilage. The Curtin lab seeks to understand the role of yeasts and bacteria in production of fermented beverages, where often the same mix of species give us an array of possible outcomes. The Kombucha SCOBY embodies this complexity and has become a major focus of our research.
 

By Keisha Rose Harrison, MS (PhD Candidate at Oregon State University)
FERMENTATION

Kombucha, a funky fermented tea, is a time immemorial beverage that has made appearances across the globe in various forms for eons. This beverage of unknown origin is shrouded in many mysteries. The potential health benefits, fermentation kinetics, and alcohol production are a few aspects that continue to baffle kombucha lovers and producers alike. Meanwhile, one area where fermentation researchers are making ground is in defining the microbiology of the Kombucha SCOBY.

In comparison to other fermented beverages, i.e. wine and beer, the amount of research done on the Kombucha SCOBY is sparse. It was known in even the earliest studies, from back in the 1960s that the starter colony was made up of both yeast and bacteria. However, there was little known about which organisms drove the fermentation, contributed to flavor, and fought off spoilage. Until recently, scientists relied upon culture-based methods (isolating microbes on media plates) to identify yeast and bacteria organisms. This technique, although cost-effective and accessible, is prone to error. Despite its limitations, scientists (Teoh et al, 2004; Liu et al, 1996), were able to come to consensus about the role of acetic acid bacteria (AAB) and saccharolytic (“sugar eating”) yeast.

By the early 2000s, we understood that AAB converted ethanol to acetic acid and built the SCOBY. Acetobacter and Gluconoacterobacter, genera of AAB, were claimed as staples and have since been renamed to fit under the genus Komagataeibacter. There was less agreement about which yeast cells eat cane sugar to produce simple sugar hexoses for the bacteria. There are accounts of Zygosaccharomyces, Schizosaccharomyces, Brettanomyces, and Candida. However, Teoh (2004) warns us that identifying organisms based upon isolation methods is generally unsuccessful.

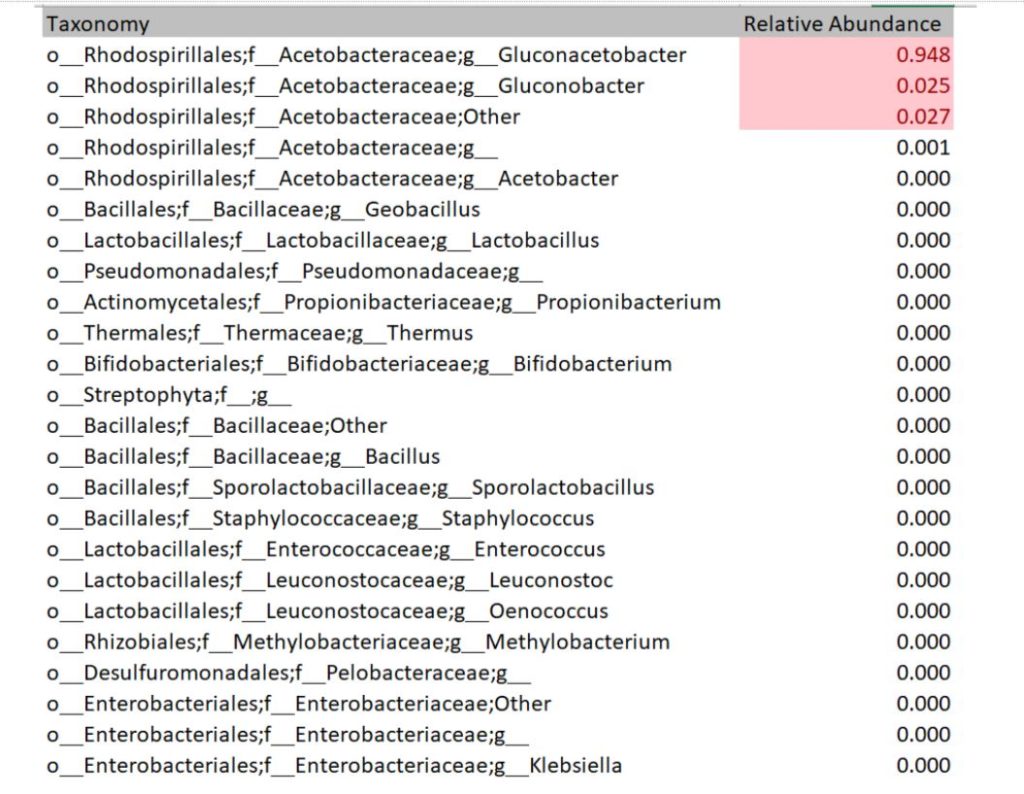
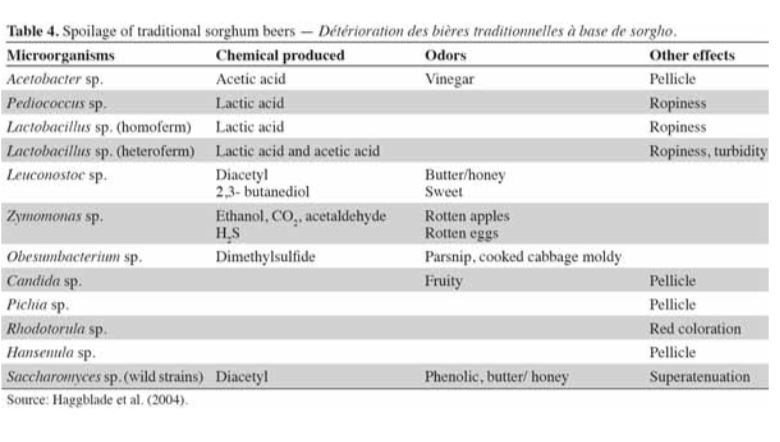
The DNA sequencing boom changed the name of the game! With the advent of affordable and reliable genetic sequencing, high-resolution taxonomic identification became a thing of reality. First scientists used sequencing technology to characterize isolated organism as a more robust culture dependent approach. However, with next generation sequencing (NGS), we could finally for the first time identify both culturable and nonculturable organisms. With NGS technology, scientists confirmed Komagatebacter as the dominant Kombucha bacteria (Marsh, 2014; Chakravorty, 2016) revealed that lactic acid and thermophilic bacteria that are likely dependent upon Kombucha preparation and region. (See table below for comprehensive list of evaluated microorganisms) These studies finally give us an in-depth analysis of kombucha microflora.

What does this mean to brewers? The recent application of advanced sequencing proved that we can apply high-fidelity identification tools to kombucha. With the precedent already set, we can now focus on designing experiments that address the larger questions. For instance, “what is common to commercial SCOBY?” and “which organisms are found in kombucha with high organic acid production?” By sequencing a mass number of SCOBY from around the globe, we will have the potential to link microbes with the chemical composition of finished kombucha products. Additionally, we will get closer to curating reproducibility and troubleshooting problematic batches.

How you can get involved? KBI members have the opportunity to participate in highly discounted genetic sequencing ($125 per sample) of the Kombucha SCOBY and broth. Fermentation scientists at Oregon State University and creating a database of microbial populations from commercial kombucha. Not only will you have the opportunity to see what your SCOBY is comprised of, but you will also be able to see your powerhouse compares to the average SCOBY. This is just the first step in understanding how the microbial population relates to kombucha features.

For more information in registering, visit: https://kombuchabrewers.org/kbi-osu-scoby-genomics-analyte-study/

Referenced Papers

  • Coton, Monika, et al. “Unraveling Microbial Ecology of Industrial-Scale Kombucha Fermentations by Metabarcoding and Culture-Based Methods.” FEMS Microbiology Ecology, vol. 93, no. 5, 2017, pp. FEMS Microbiology Ecology, 2017, Vol. 93(5).
  • Chakravorty, Somnath, et al. “Kombucha tea fermentation: Microbial and biochemical dynamics.” International journal of food microbiology 220 (2016): 63-72.
  • El-Salam, S. S. A. (2012). 16S rRNA gene sequence detection of acetic acid bacteria isolated from tea kombucha. New York Science Journal, 5(3), 55-61.
  • Jankovic, I., Stojanovic, M., 1994. Microbial and chemical composition, growth, therapeutical and antimicrobial characteristics of tea fungus. Mikrobiologija 33, 25 – 34.
  • Liu, C-H., et al. “The isolation and identification of microbes from a fermented tea beverage, Haipao, and their interactions during Haipao fermentation.” Food Microbiology 13.6 (1996): 407-415.
  • Marsh, Alan J., et al. “Sequence-based analysis of the bacterial and fungal compositions of multiple kombucha (tea fungus) samples.” Food microbiology 38 (2014): 171-178.
  • Mayser, P., Gromme, S., Leitzmann, C., Gru¨nder, K., 1995. The yeast spectrum of the ‘tea fungus Kombucha’. Mycoses 38, 289 – 295
  • Shade, Ashley, D. H. Buckley, and S. H. Zinder. “The kombucha biofilm: a model system for microbial ecology.” Final report on research conducted during the Microbial Diversity course. Marine Biological Laboratories, Woods Hole, MA (2011).
  • Teoh, Ai Leng, Gillian Heard, and Julian Cox. “Yeast ecology of Kombucha fermentation.” International journal of food microbiology 95.2 (2004): 119-126.

By Dr. Chris Curtin & Keisha-Rose Harrison of Oregon State University & Hannah Crum of Kombucha Brewers International & Kombucha Kamp

Thank you to everyone who participated in the first round of the KBI & Oregon State University Kombucha SCOBY DNA Sequencing study. With your help we sequenced nearly 100 samples provided by over 70 different companies from 26 states and 9 different countries around the world. The largest SCOBY DNA Sequencing Study to date! Previous studies that sought to improve our knowledge of SCOBY microbial populations have been more limited in scope. We now have more data points which can provide a clearer understanding of which microbes are common across commercial SCOBYs, and an opportunity to learn which strains may be responsible for different fermentation and flavour outcomes. 

DNA Sequencing Analysis Process

For each sample received, we blended a standardized amount of SCOBY under controlled conditions, and then extracted the DNA from all microbes present in the sample. Regions of DNA that can be interpreted as ‘barcodes’ were amplified from each sample and sequenced using Illumina Miseq technology. The sequences of these ‘barcodes’ were compared to large databases of fungi and bacteria, and assigned to Operational Taxonomic Units (OTUs). In this study OTUs were defined at a standard cutoff of 97% similarity. In other words, if two ‘barcodes’ are only 96% similar in DNA sequence they would not be grouped into the same OTU.

Is an OTU representative of a species? Sometimes yes, but often no – within many genera (particularly for bacteria) individual species cannot be reliably differentiated using current DNA ‘barcodes’. This approach is highly robust when used to provide resolution at the genus level, meaning that all OTUs for one type of organisms are grouped together. For example, if a SCOBY contained both Lactobacillus casei and Lactobacillus plantarum their DNA ‘barcodes’ would be grouped together as Lactobacillus.


After the samples are matched at the genus level, each ‘barcode’ detected is counted to provide the frequency with which it appears in the sample to determine the proportion at which each genus of the whole bacterial or fungal population exists. These are the numbers of the sample represented as as follows: Dekkera 0.67 means that 67% of the fungal population in your sample belongs to the Dekkera genus.

Interpreting Your Results

Each sequencing report provided participants the bacteria and fungi profile of the sampled SCOBY. Below is an example of a report of bacteria detected. The genus level is read as “g_GENUS”. The number provided indicates how much of bacteria was present  in the sample. For instance, 94.8% of this example sample is Gluconoacetobacter. Some other OTU groupings could not be reliably defined at genus level, in which case they will be named at family level but assigned as ‘Other’ or ‘g__’ at genus level. In this example, 2.7% of the bacterial population is made up of bacteria within family Acetobacteraceae that could not be assigned to a genus.

Using the values provided we can create a visual of the bacteria composition.

Please note that the taxonomic name of organisms can change. For example, Dekkera is now known only as Brettanomyces (previously the names were interchangeable), while Gluconoacteobacter xylinum and Acetobacter xylinum have been reassigned to Komagataeibacter xylinum.  We’re sorry, but this is just as confusing for seasoned microbiologists!

Q: “My report says “unknown” for some of the organisms. What does that mean?”
A: Sometimes ‘barcodes’ are not able to be definitely assigned at the genus level due to a lack of resolution or because the sample may contain a species that has not yet been identified by the microbiology community. These OTUs are then grouped at the family level and genus may be given as ‘undefined’, ‘unknown’ or ‘other’.

How do your results compare to the “average” SCOBY

Each company received an individual report listing the respective percentages of each type of bacteria and yeast found in their sample.

In the aggregate, it was found that the organisms occurred in these relative percentages:

TABLE OF ORGANISMS FROM GREATEST TO LEAST FOR YEAST & BACTERIA


Making Sense of the Study

DOMINANT YEAST AND BACTERIA

As presented at KombuchaKon18, results from the study confirm that there is variability in SCOBY samples collected from different brewers. However we were able to identify core microbes that are present in most SCOBYs. On average, the most common fungi were Brettanomyces/Dekkera and Starmerella, while the most common bacteria were Gluconacetobacter, Gluconobacter, and Lactobacillus.

The near constant fluctuation of organism name changes presents its own kind of challenge. In previous SCOBY & Kombucha DNA Sequencing studies, for example, there are no instances of Starmerella being detected, however, when doing cursory research, it turns out this is a newer nomenclature for many species that used to be known as different types of Candida spp. which have been identified in other studies. However, without going to the species level, it is difficult to ascertain which stains correspond to those found in previous studies versus which may be novel to Kombucha.


HOW DOES THIS INFLUENCE FLAVOR AND FERMENTATION?

Identifying the prevalent organisms within the SCOBY is the first step towards answering this question. We do know that different types of yeast convert sugar to alcohol at different rates. It is also known that different types of bacteria produce varying kinds of organic acids in similar fermentation models, i.e. beer, wine (see table below). There is likely some overlap in how these microbes influence kombucha.

For the next study, we aim to determine how different microbial profiles influence your finished raw product. Continued participation in these studies will go a long way to addressing these questions.

In the meantime, some of the organisms found in Kombucha are also found in wine & beer. Here are some links to charts that outline the flavor profile and characteristics of some of those organisms.

UC Davis Wine Server Database

Our yeast and bacteria are considered spoilage for beer & wine!

ARE SCOBYs MORE VARIABLE IN THEIR BACTERIA OR YEAST POPULATIONS?

On the whole, there seems to be more variability in the bacteria profiles of SCOBY samples. Bacteria are responsible for converting most of the ethanol into organic acids and for building the SCOBY. We will continue to study how different types of bacteria influence the secondary fermentation.

VARIATION BETWEEN SCOBY AND STARTER FLUID MICROBIAL POPULATIONS

For this study we only examined the SCOBY and not the starter fluid. For the second sequencing study we will look at both! As mentioned in the presentation at Kombuchakon, acetic acid bacteria build the the SCOBY. They do not have to live in the SCOBY to produce acids (e.g. vinegar is made without a SCOBY), just as yeast do not have to live in the SCOBY to degrade sugars. The SCOBY does, however, enable repeated fermentations to be started with multiple species present, something that would be difficult to achieve otherwise. The SCOBY effectively buffers microbes against what would otherwise be a fluctuating environment as the sweet tea goes through alcoholic fermentation and acetification. .

METADATA ANALYSIS

At the time of sample collection, a couple of questions were asked in order to analyze the data according to a couple of variables – namely age of the culture sampled and location. We then sent out a follow up survey for additional metadata including age of the culture sampled, type & quantity of tea; type & quantity of sugar; and batch size to see if the data would show any trends or patterns based on these variables. Not all participants answered this part of the survey and we hope to have a more thorough Metadata Analysis available in future studies. This will greatly enhance the applicability of study results to the KBI community.

REGIONAL VARIATION

Preliminary analyses suggest there may be some region-to-region variances in the bacteria and fungal composition of the SCOBY, though it should be noted that sample numbers and the amount of metadata provided were uneven. Future studies will request additional metadata in order to determine the influence of types & quantities of tea, sugar and other variables.

NEXT STEPS

KBI & OSU will be partnering on a new DNA sequencing study and will also be conducting an analyte study. We hope to receive at least as many samples as last time if not more so that our knowledge base will continue to deepen. Stay tuned for more details coming soon!

KBI is excited to announce a partnership with Oregon State University to study the organisms present in Kombucha cultures from around the United States. The purpose of the study is to try sequence numerous samples from a wide variety of places to answer the question of “What is a SCOBY?”

After sequencing all of the samples, the data will be analyzed to see which organisms are common to all cultures, which are not, which are unique to specific locations. This information is the first step to gaining a deeper understanding of how the microorganisms contribute to flavor, alcohol content and more.

HOW TO PARTICIPATE IN THE STUDY

We are aiming for 200+ total samples to be analyzed in order to have a sufficient pool to draw conclusions. We invite you to take advantage of this opportunity to learn what is in your culture while also contributing to the deeper body of knowledge about Kombucha as a whole. Each participant will be provided a detailed report with all of the organisms present in their culture.

If you are a current KBI member, the cost is only $100 per sample. Part of the cost goes directly to the university to cover the sequencing, part of it is to cover shipping of kits and the purchase of the kit supplies and the rest covers administrative costs.

Non-KBI members are also invited to participate!. The cost is $250 per sample for non-members. Or join KBI today to receive the member pricing.

DNA sequencing typically costs several hundred up to thousands of dollars per sample, so this is a significant savings for valuable information. The data will only ever be presented in an aggregate format to protect confidentiality for all participants.

We have a tight timeline (all samples need to be received by October 15th extended to October 30th!), so please sign up today.

We look forward to your participation and hope to see you at KombuchaKon18 – Defining Our Culture where the results will be presented.