South Carolina Dept of Revenue Not to Tax Kombucha as Alcohol
Background Recently, the Department of Revenue in South Carolina was posed a curious question. Is kombucha considered a “similar fermented beverage” to beer? This question created a domino effect and some confusion as to how kombucha with an ABV of 0.5% and below ought to be regulated and by whom. “Crisis creates community” quipped KBI […]
Background
Recently, the Department of Revenue in South Carolina was posed a curious question. Is kombucha considered a “similar fermented beverage” to beer? This question created a domino effect and some confusion as to how kombucha with an ABV of 0.5% and below ought to be regulated and by whom.
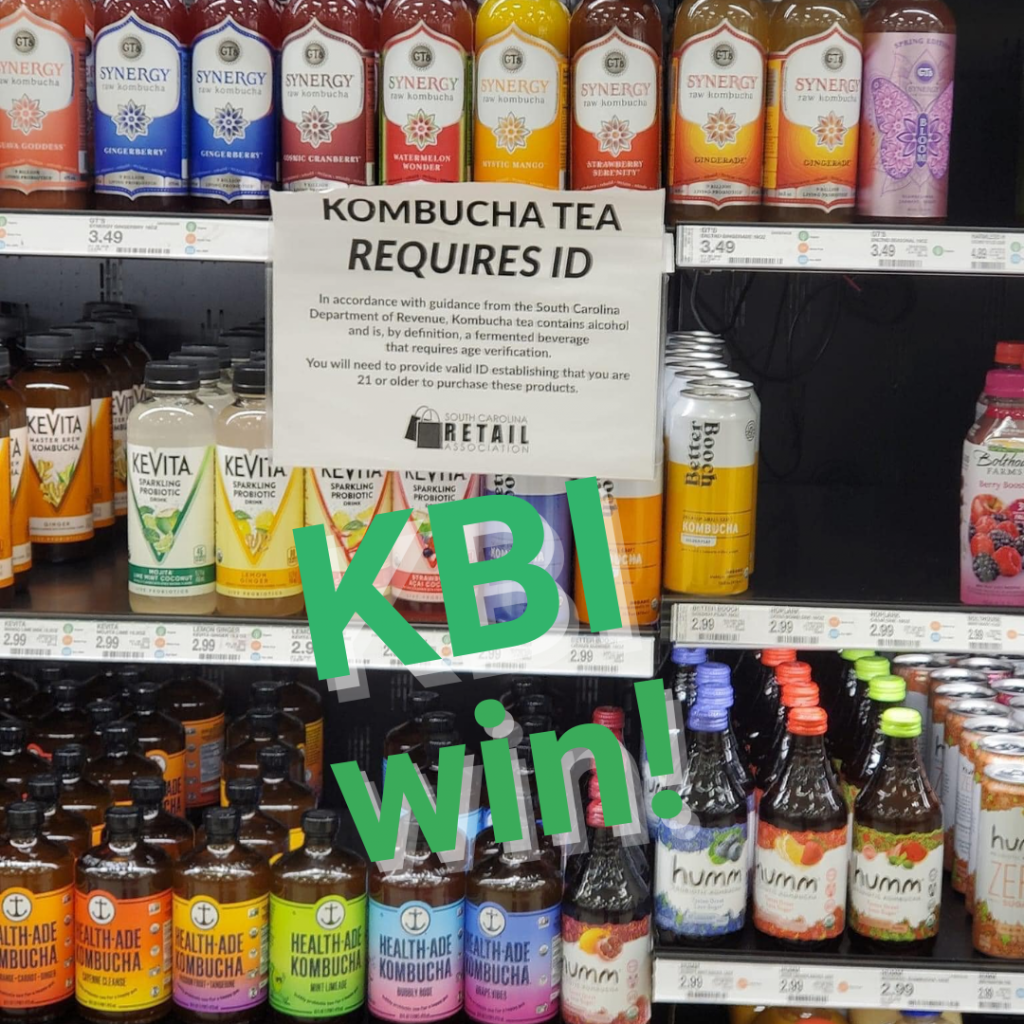
“Crisis creates community” quipped KBI President, Hannah Crum upon receiving urgent emails minutes apart from Chairman of the Board, Zane Adams of Buchi Kombucha and GT Dave of GT’s Synergy Kombucha. Those emails spurred immediate phone calls to the South Carolina Retail Association (SCRA), helmed by Lee Ann Watson, to learn more about the notice that had just been sent out from their organization.
She pointed KBI to the SC DOR as the body that had issued a guidance indicating they were looking into the matter and that out of an abundance of caution, they advised retailers to start carding anyone purchasing kombucha.From there, web searches revealed that this issue had been brewing for a month or so before it came to KBI’s attention according to a blog post by Brook Bristow of Bristow Beverage.
Health-Ade, Humm, and Brew Dr all reached out to share resources and support. David Ransom of McDermott, Will & Emery, KBI’s lobbying firm and legal counsel, also weighed in and offered advice.
Ultimately, after 3 weeks of intense conversations and sharing of resources, the SC DOR issued an updated guidance indicating that kombucha would NOT BE REGULATED LIKE ALCOHOL! A huge win for the industry and another example of KBI’s advocacy in action. Read the updated guidance on the SC DOR website.
Here are some of the sensationalized articles describing the situation
Kombucha is not similar to beer
The confusion stems from a statute that defines “nonalcoholic or non-intoxicating” beverages in their Tax Code as follows:
(1) all beers, ales, porters, and other similar malt or fermented beverages containing not in excess of five percent of alcohol by weight;
(2) all beers, ales, porters, and other similar malt or fermented beverages containing more than five percent but less than fourteen percent of alcohol by weight that are manufactured, distributed, or sold in containers of six and one-half ounces or more or the metric equivalent; and
(3) all wines containing not in excess of twenty-one percent of alcohol by volume.
One of only 4 states with this type of definition on the books, it was intended to allow beer and wine to be sold on Sundays. Since alcoholic beverages up to 6.5% ABV are considered “nonalcoholic” why then would this impact kombucha? In lieu of a definition of non-alcoholic beverage that mirrors the Federal definition of anything below 0.5%, it considers any beverage from 0-6.5% ABV to be under their regulatory and taxable purview.
When these laws were written and adopted in 1996, the commercial kombucha industry was in its infancy and was not sold in South Carolina at that time. Clearly the lawmakers were not intending for this definition to include kombucha, water kefir, or any of the traditionally fermented low-alcohol beverages that have become more popular in recent decades.
KBI is actively collaborating with a wide variety of stakeholders to assist lawmakers in better understanding what exactly is kombucha and how its materially different than beer or other high alcohol ferments.
Kombucha is an acetic acid ferment like vinegar
Vinegar Fermentation Definition
Fermentation is …(an) anaerobic (non-oxygen-requiring) pathway for breaking down glucose, one that’s performed by many types of organisms and cells. In fermentation, the only energy extraction pathway is glycolysis, with one or two extra reactions tacked on at the end.1
Vinegar is the product of a two-stage fermentation. In the first stage, yeast convert sugars into ethanol anaerobically, while in the second ethanol is oxidized to acetic (ethanoic) acid aerobically by bacteria of the genera Acetobacter and Gluconobacter.2
Vinegar production dates back at least to 200 BC, and it is an illustrative example of microbial biotransformation.3
The “microbial biotransformation” of sugared tea that defines kombucha is a two-step process. First, ethanol is created through fermentation of sugar by yeast. The yeast secrete an enzyme, invertase, that splits the disaccharide compound known as sugar into its monosaccharide components – glucose and fructose. Fermentation creates CO2 (carbon dioxide) and ethanol.
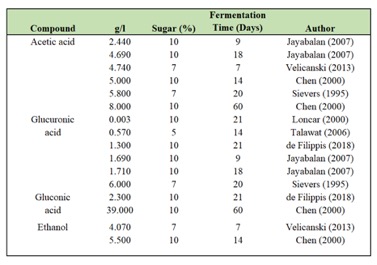
Then through respiration, acetic acid bacteria (AAB) convert the ethanol produced into organic acids – acetic and gluconic acid primarily with some lactic, glucuronic and malic depending on the substrate (ie type of tea/sugar being fermented).
Trace amounts of ethanol remain as a natural preservative that prevents pathogens from colonizing the liquid. Several studies have shown kombucha to be antimicrobial against a wide range of common pathogens including Salmonella, Listeria, E. coli and many others.
Hard Kombucha
Of course, anyone brewing “Hard Kombucha” would be subject to all the laws regulating alcoholic beverages as they are intentionally created to have a higher alcohol content to be consumed by adults of legal drinking age.
The KBI Code of Practice definitions of Hard Kombucha clearly indicate that non-native yeasts need to be added to yield a higher alcohol content.
3.8. Hard Kombucha: A kombucha which is crafted to yield a higher alcohol content than traditional kombucha using non-native yeasts or combining with higher alcohol containing beverages such as beer, cider, wine, spirits, etc. These products contain an alcohol content greater than 4% ABV and are subject to local excise taxes.
3.8.1. Crafted Hard Kombucha: A traditional kombucha fermentation to which additional non-native yeast is added at a later phase resulting in a higher than possible alcohol content.
3.8.2. Spiked Hard Kombucha: A kombucha to which alcohol is added to yield a higher alcohol beverage. Could also be termed “Kombucha Cocktail.”
Traditionally Fermented, Healthy Low Alcohol Beverages
Kombucha, water kefir, ginger bug, milk kefir, and a wide range of traditionally fermented beverages have been consumed by humans since the dawn of time. The trace amounts of ethanol as discussed above serve a specific preservative function with a medicinal side benefit of making it easier to absorb the nutrients.
While it would be wonderful to create a new beverage category, the process is long and arduous and requires a lot of financing for education and lobbying. As such, KBI has chosen to specifically focus on updating the Internal Revenue Code (IRC) specifically for kombucha to raise the threshold for taxation from 0.5% ABV to 1.25% ABV which harmonizes with culturally similar countries in North America and across the globe.
We hope that you will support our lobbying efforts and sign our petition as they ensure that as an industry we are able to self-regulate and be compliant, especially when the “laws of man are more closely harmonized to the laws of nature.”
Anyone who regularly enjoys kombucha knows from experience that it is non-intoxicating and consumes it for the wide range of health benefits it provides. KBI is process agnostic as “any kombucha is better than no kombucha.” Energy drinks, sodas, sugar-laden, chemical-laden and non-fermented “probiotic” sodas are capitalizing on a trend while also tricking consumers into choosing cheaper products with few if any benefits and oftentimes, in the case of sodas and energy drinks, “poison in pretty packages pimped by pretty people.”
The KBI Code of Practice aims to preserve the traditional fermentation processes with manufacturing controls applied to create safe, nutritious beverages that can be accessed by anyone. We also believe that educated consumers make intelligent choices. The KBI Seal Program will ensure that “what’s on the label, is what’s in the bottle.”
If the last two years have taught us anything, it’s that health needs to be a top priority at all times. Why not go to the root cause and support your microbiome with traditionally fermented foods and drinks!

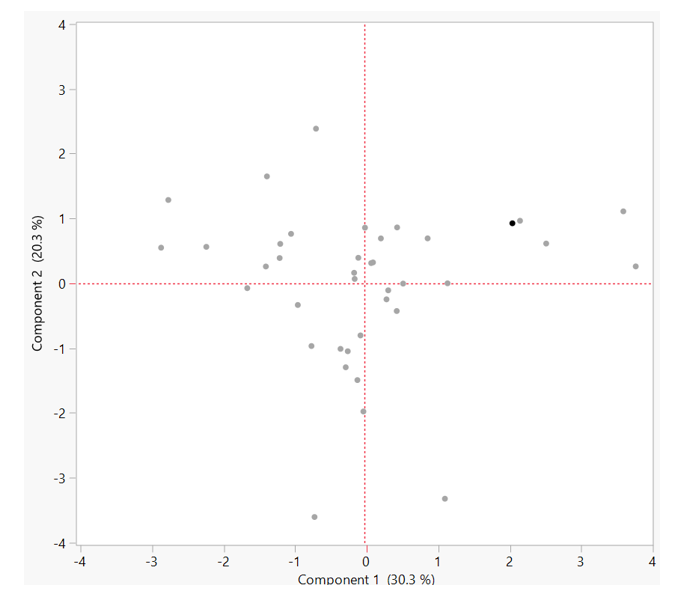
 Before diving into the results, let’s review the study methods and approach. Both parts relied upon the same DNA sequencing technique to determine microbiota from sample submissions. DNA was extracted using a method modified from traditional column-based extraction protocols. Measures were used to ensure that samples were thoroughly mixed to best represent the sample. Amplicon sequencing was the method of DNA sequencing. During this process, conserved regions of bacterial rDNA and fungal DNA were amplified and sequenced using fluorescent markers.
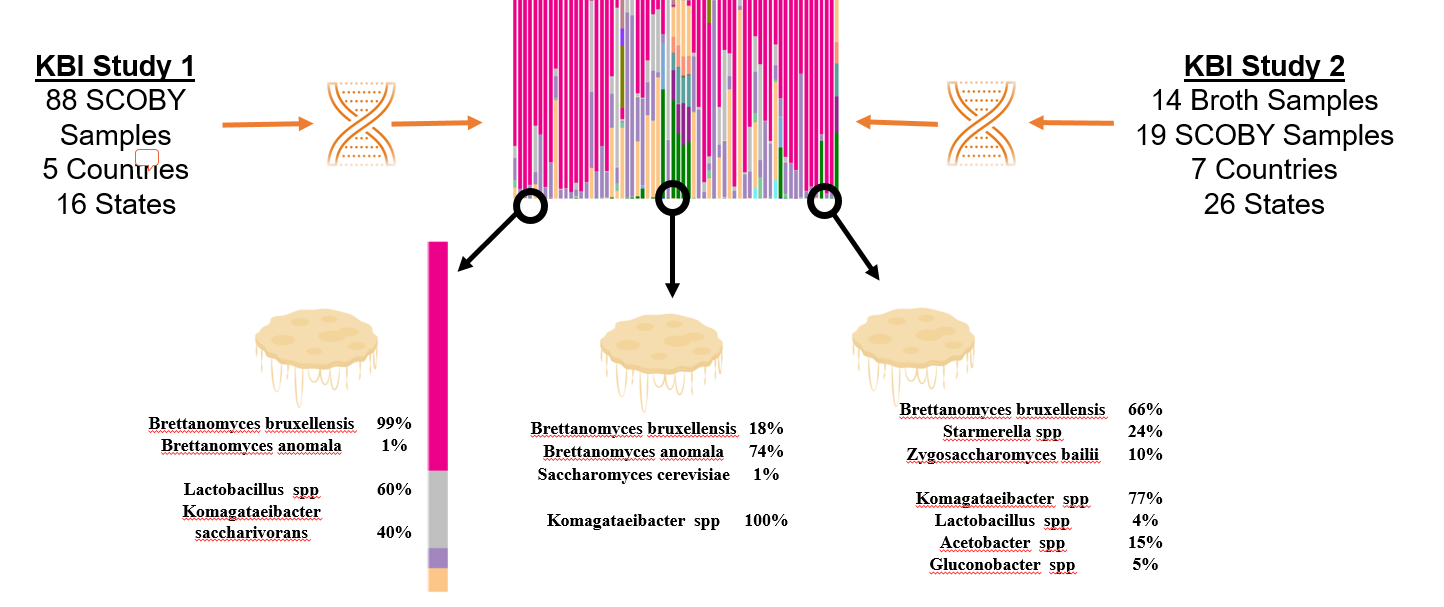
 Keisha Harrison, M.S., is a PhD candidate of Fermentation Science in the Food Science & Technology Department at Oregon State University (OSU). She received a Bachelor of Arts in Cell Biology and Biochemistry from Rice University and a Master of Science in Nutrition from the University of Houston. Keisha was drawn to Kombucha research because it is a beautifully complex system to study microbial interactions. She aims to understand the links between the microbial landscape of the Kombucha SCOBY and the sensory experience. She believes to get at the heart of Kombucha, we have to get better acquainted with it first!
 Chris Curtin, Ph.D. is an Assistant Professor in the Food Science & Technology Department at Oregon State University (OSU). Prior to joining OSU in 2016 he lead the Biosciences research group at the Australian Wine Research Institute, where he was responsible for development of yeast strains and development of strategies to mitigate spoilage. The Curtin lab seeks to understand the role of yeasts and bacteria in production of fermented beverages, where often the same mix of species give us an array of possible outcomes. The Kombucha SCOBY embodies this complexity and has become a major focus of our research.
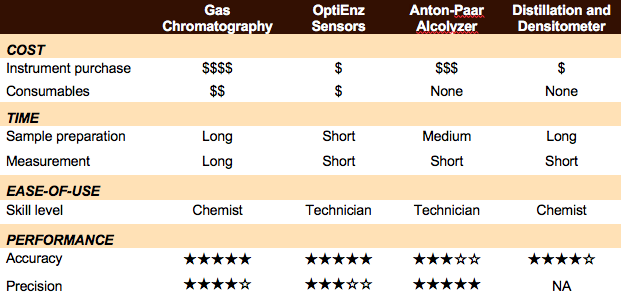
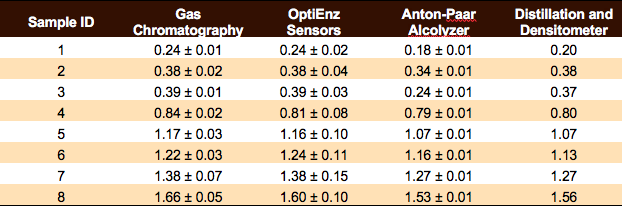
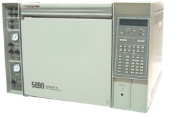 Headspace gas chromatography – flame ionization detection (HS/GC-FID) measurements and sample preparation were performed using AOAC methods for determination of ethanol in kombucha (AOAC 2016.12). Analysis was completed on a HP 5890 Series II gas chromatograph (four measurements per sample) with a Restek Stabilwax-DA capillary column using nitrogen as the carrier gas, and resolution of methanol, ethanol, isopropanol, 1-propanol, and acetone was possible using this setup. A calibration curve was constructed using Cerilliant ethanol standards purchased from Sigma-Aldrich.
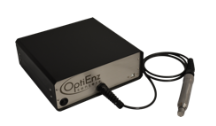 Ethanol measurements were performed using an OptiEnz Sensors ethanol sensing system. The instrument was calibrated over 10 minutes using prepared ethanol standards. Ethanol measurements (six measurements per sample) were made by diluting 0.1 mL of sample into 50 mL of buffer, immersing the sensor probe into the dilute solution and allowing the system to stabilize for three minutes.
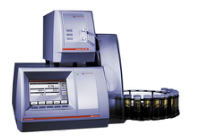 Density and Alcolyzer measurements were performed using an Anton-Paar DMA 4500 M-EC with Enhanced Calibration for Ethanol paired with an Alcolyzer Beer ME module and Sample Handling Unit (Xsample 22). The instrument was calibrated with degassed, deionized water and achieved a density measurement of 0.99820 ± 0.00001 g/mL at 20ºC. Sample analysis (six measurements per sample) was performed by pumping 40 mL of sample through the system, bringing the sample temperature to 20.00 ± 0.01°C, and then collecting density and Alcolyzer measurements.
 Kombucha samples (100 mL per sample) were distilled according to the TTB-recommended distillation-specific gravity method (AOAC 935.21). Density measurements (one measurement per sample) were made using the Anton-Paar densitometer.
 Keisha Harrison, M.S., is a PhD candidate of Fermentation Science in the Food Science & Technology Department at Oregon State University (OSU). She received a Bachelor of Arts in Cell Biology and Biochemistry from Rice University and a Master of Science in Nutrition from the University of Houston. Keisha was drawn to Kombucha research because it is a beautifully complex system to study microbial interactions. She aims to understand the links between the microbial landscape of the Kombucha SCOBY and the sensory experience. She believes to get at the heart of Kombucha, we have to get better acquainted with it first!