About Us
Menu
Advertising
Menu
By Keisha Rose Harrison
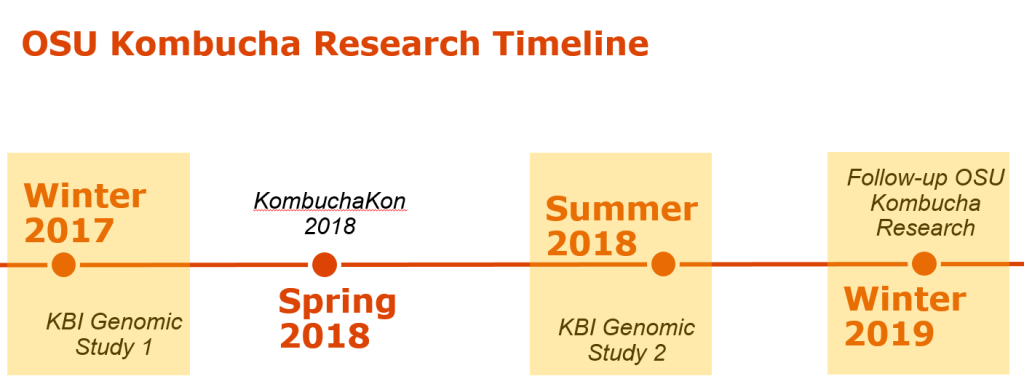
The KBI/OSU SCOBY Genomic Study took place from November 2017 to September 2018 as a two-part study. Part 1 asked the questions “what does the Kombucha SCOBY consist of?” and “how diverse is the Kombucha SCOBY?” in regards to the collective microbiota (the bacterial and fungal populations). Participants were asked to submit representative samples from a SCOBY (solid starter culture) with information regarding current location and time of use.
Part 2 was designed as a follow-up study to ask more specific questions about Kombucha starter cultures and brewing practices. Participants were asked in the Part 2 study to submit either broth (liquid starter culture) or SCOBY samples and to answer a questionnaire about brewing practices (including tea type and brewing volume). Data collected from both studies were combined to strengthen the scope of the study and conclusions about microbiota patterns. A total of 107 SCOBY and 19 Broth samples were collected and evaluated from 7 countries and 26 US states.
Before diving into the results, let’s review the study methods and approach. Both parts relied upon the same DNA sequencing technique to determine microbiota from sample submissions. DNA was extracted using a method modified from traditional column-based extraction protocols. Measures were used to ensure that samples were thoroughly mixed to best represent the sample. Amplicon sequencing was the method of DNA sequencing. During this process, conserved regions of bacterial rDNA and fungal DNA were amplified and sequenced using fluorescent markers.
What exactly does that mean? Each bacterial and fungal cell has a “fingerprint” in its DNA that is generally conserved among members of a genus and species. It is this “fingerprint” that is copied and read. A bioinformatics pipeline is subsequently used to assign species-level identification for yeast and genus-level identification for bacteria. Relative abundance is determined as the number of times a copy of the “fingerprint” is recognized in proportion to all of the fingerprints. Bacterial and fungal relative abundances are reported separately.

How to interpret your report? Participants received a report that included the participant ID (number used to ensure confidentiality), a list of bacteria genera with relative abundance, and a list of yeast species with relative abundance. An example of a “bacterial profile” report is depicted below. From this report, we can observe the composition of the bacterial population from a submitted sample. Only bacteria that were present at >0.01% were included in the report. A majority, 43.7%, of the bacterial population in the sample was identified as Lactobacillus genus. The method of interpretation can be used for the fungal or yeast reports.
|
Now that the relative abundance of bacteria and yeast are known, the next question is “so what does this mean?” What does a percentage tell us about the fermentation, taste, and quality of kombucha? On an individual level, each sample can serve as a building block of knowledge. Any quality assurance and control plan begins with a detailed overview of the system. Troubleshooting and monitoring starter culture health are all contingent upon knowing the composition of a “normal” and “healthy” culture. The impact of this research is strengthened when we zoom out and look at the whole sample population.
What does the data from both Part 1 and Part 2 tell us? By looking at the microbiota of multiple samples from various geographic locations, we began to answer questions about starter culture diversity. With the information provided by study participants were able to identify the most abundant Kombucha microorganisms, determine the impact of location and culture conditions on the microbiota, and classify starter culture “types”. Samples were collected from both solid and liquid starter cultures have the same common bacteria and yeast populations. Regardless of source, the most common yeast species (based upon an average of relative abundance) are Brettanomyces bruxellensis, Brettanomyces anomala, and Issatchenkia orientalis. The most common bacterial genera are Lactobacillus, Komagtaebacter, and Acetobacter. The proportions of bacteria genera vary depending upon starter culture source so that lactic acid bacteria is more abundant on average in broth than the SCOBY pellicle. Respectively, more acetic acid bacteria is abundant on average in the SCOBY pellicle than the broth. This makes sense we consider that the bacterial species, Komagaetibacter xylnium, is often credited with the formation of the physical SCOBY structure.
Taking a step back, let’s consider what this means. More of the bacteria type that produces ethanol, lactic acid, and carbon dioxide are on average found in broth. Whereas, more of the bacteria type that oxidizes ethanol and produces acetic acid is found in SCOBY. This diversity may be in part because of how the floating physical structure creates an air-liquid interface to support an oxygen-rich environment. Furthermore, we compared physical and liquid samples from the same producer to better understand the dynamic.
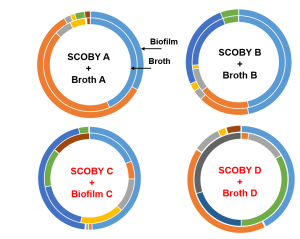
Let’s breakdown the figure below. The outside ring represents the SCOBY microbiota and the inside represents the BROTH microbiota. The color blocks represent top 5 microbial groups (so the most abundant bacteria and yeast genera). Blocks of the same color depict the same microbial group. The size of the block correlates the amount of that microbial group present. From the figure, we are comparing 4 BROTH and 4 SCOBY samples each BROTH/SCOBY pair is from the same location. The figure illustrates that in some instances the microbiota is comparable between SCOBY and BROTH and in some instances they differ. What does this mean? We cannot assume that the BROTH and SCOBY are interchangeable.
How to best understand ALL of this data? SCOBY sequencing revealed that there are many, many, MANY different species of yeast and bacteria in the Kombucha starter culture population. Looking at just the average SCOBY or BROTH composition is not representative of most individual samples and underscores the importance of starter culture diversity. A better way to compare starter cultures of rich diversity is to group similar microbiota profiles. In other words, by clustering samples that have similar amounts of Bacteria A and Yeast B, we are able to determine “types” of starter cultures. We ultimately used a hierarchical clustering analysis approach to sort through individual data and identify 5 groups within the overall population. These groups represent patterns of yeast and bacteria that any individual samples may fall under. The figure below depicts how specific types of microorganism are likely to appear together in a starter culture. Starter cultures with a large amount of the yeast genera, Brettanomyces, are less likely to be present in a culture with Starmerella/Candida. The “types” of starter culture can be described as follows:
[table id=8 /]
To determine how each starter culture type influences fermentation parameters, a preliminary study was undertaken in Dr. Chris Curtin’s lab at Oregon State University. Those findings will be available later in the year in the form of an academic publication that will be shared on the KBI site.


No spam. We never sell your data. Update your preferences or unsub anytime.

Nicole Leon, Verde Sol, Belen, Costa Rica Q: When did you first discover kombucha? A: I first discovered kombucha 5 years ago. Q: Why did
Willie Kennon, Rogue Kombucha, Grants Pass, OR Q: When did you first discover kombucha? A: I started drinking kombucha around 2011 Q: Why did you
Salonii Hamirwasia, Zoh Probiotics, Mumbai, Maharashtra, IND Q: When did you first discover kombucha? A: I first discovered kombucha in 2003 Q: Why did you start
Exciting Changes to Our 2024 Events Amidst KBI’s Transition and Post-COVID Pivot As we navigate a transition period with new leadership and adjust our strategies
1 thought on “KBI/OSU Genomic Study Webinar”
Comments are closed.