Kombucha Brewers International & Oregon State University Analyte Study
A Summary of Kombucha Microbiome Research
by Keisha Rose Harrison
The Curtin lab at Oregon State University is interested in applying “-omics” approaches and cutting-edge technology to better understand fermented products. Unlike traditionally studied beverages, i.e. wine and beer, Kombucha is part of a burgeoning field of research. Brewers of all levels recognize that there is little consensus regarding the classification of Kombucha products.
The Kombucha sold on the market is widely varied in its “tea-flavour”, juice additives, residual sugar concentrations, organic acid concentrations, as well as, methods of production. There is a need to differentiate “true” Kombucha from “Kombucha-inspired” products. One of the goals of the OSU research team is to better characterize Kombucha products through chemical profiling. The KBI/OSU Analyte Study was designed with such an intention in mind. Participants were encouraged to submit a sample of “finished product” (Kombucha that is considered ready for shelves) for an analysis of non-volatile compounds. The intention of the study was to group products of a similar chemical composition to identify different styles of Kombucha currently on the market.
Key Metabolic Steps
Before we jump into the research, let’s identify some of the key metabolic steps that occur during Kombucha fermentation. Kombucha is made when sweetened tea is acidulated (pH is reduced) and inoculated with a starter culture. What does these steps mean for the Kombucha brewer? As previous research at OSU has shown, a large portion of the bacterial population of the starter culture is acetic acid bacteria. The reduction in pH creates a favorable environment for the microorganisms that play a role in the transformation of sweet tea into Kombucha.
The yeast population in the starter culture initiate the breakdown of larger sugars. The rate of sucrose hydrolysis is dependent upon the composition and concentration of yeast in the starter culture. Yeast contribute to the fermentative production of ethanol and carbon dioxide. Acetic acid bacteria and lactic acid bacteria generally oxidize ethanol into organic acids, including acetic acid, lactic acid, and gluconic acids. Raw materials, such as fruit juices, can contribute to vitamin and mineral composition. Tea choice influences amino acid, catechin, and tea polyphenol composition. All of these components contribute to the variety found in Kombucha.
How Did the Study Work?
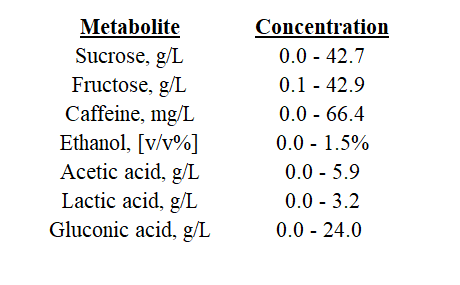
In general Kombucha metabolites include residual sugars, proteins, amino acids, minerals, organic acids, and polyphenols. To best profile Kombucha, these different groups of compounds need to be evaluated. Nuclear Magnetic Resonance (NMR) sprectroscopy allows for multiple peak measurements from a single spectra. Unlike conventional methods of GC or HPLC, multiple compounds can be measured from a single sample. Each proton is a positively charged particle whose spin is influenced by neighboring atoms. This allows for us to measure fructose and citric acid at the same time! Furthermore, NMR data has been shown to be reproducible and highly precise. Upon receipt of samples, they were normalized and loaded into an 800MHz spectrometer for H-NMR profiling. For ease in sampling handling, only volatile compounds were analyzed. The range of a few metabolic markers are displayed below.
Metabolite Concentration
Sucrose, g/L 0.0 – 42.7
Fructose, g/L 0.1 – 42.9
Caffeine, mg/L 0.0 – 66.4
Ethanol, [v/v%] 0.0 – 5.6%
Acetic acid, g/L 0.0 – 7.5
Lactic acid, g/L 0.0 – 3.2
Gluconic acid, g/L 0.0 – 24.0
Upon an initial glance, it seems unlikely that only finished Kombucha product was submitted. Ethanol levels vary from 0.0% to 5.6% weight by volume. These values suggest that high alcohol Kombucha products were included within the original analysis. Furthermore, non-significant values for organic acids, such as acetic and lactic acids, hint at the possibility that non-fermented tea was additionally submitted for analysis. Limited participant response to the study questionnaire made it challenging to confirm these explanations.
What Can Be Learned?
Without concrete information about how the sample was produced and which tea base, sugar amounts, fermentation times, etc., the meta-data is not available to make correlations between Kombucha composition and production practices. Regardless, let’s consider the original intention of the study: to approach a definition for commercial kombucha.
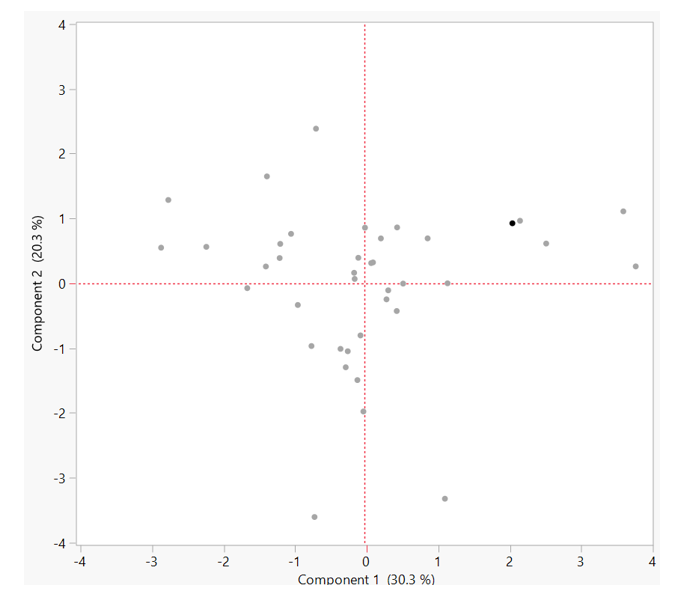
A principle components analysis (PCA) was the analytical tool used to approach this goal. The plot of this analysis is shown below. The axes, or “components”, represents characteristic of variability. The orientation of samples along these components explain 50.6% of group variation and the effect of varied influences on original characteristic. Furthermore, how the “dots” or samples orient along these components demonstrate the degree of “like-ness”. Samples with a similar overall compositions will appear clustered. Meanwhile, samples with disparate overall compositions will appear at opposite ends of the axes.
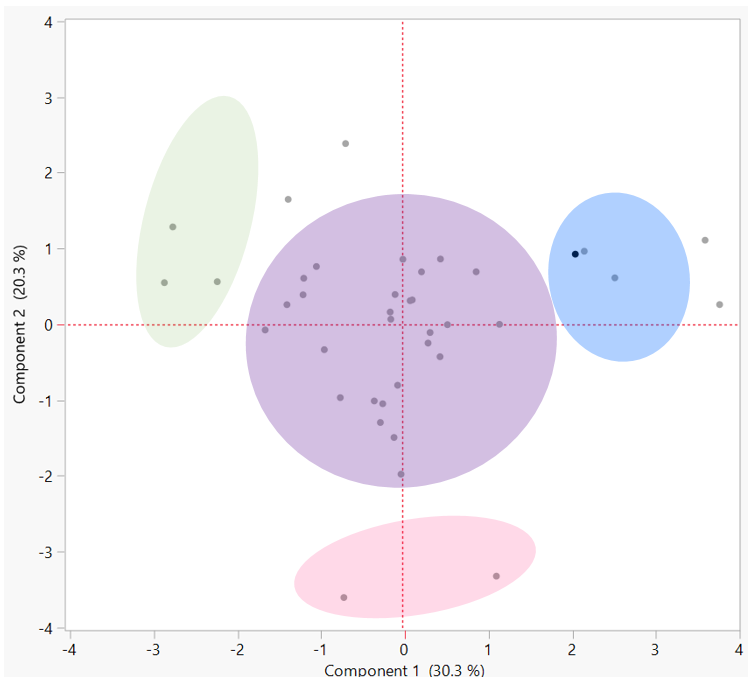
Let’s make sense of this. Circles were overlaid on clusters of samples or samples that appear alike. Using this method, we can identify the largest group of like samples. We will assume that these samples represent the range of the most typical Kombucha product. With the other samples removed, we can reassess the metabolite range as below. These values represent the range of a “typical” Kombucha product. With additional information about production practices and sample description, we can use this range as a guideline when defining Kombucha in its various stages.
Where Can We Improve in Future Studies?
It is worth noting that this summary did not go into detail about the significance of all of the various metabolites displayed in the individual reports. This is because we do not know the relationship between these metabolites and Kombucha fermentation quite yet. Given how varied Kombucha practices and materials are, we can only begin to address the question of fermentation kinetics with a standardized system. These research projects are in the works and can only continue with your support. We encourage everyone to continue to participate and to answer the metadata questions as thoroughly and accurately as possible to provide clearer insights into how metabolites correspond to production process and ingredients.
Stay tuned for the next KBI/OSU Study – coming Fall 2019
An average of all the components found in all submitted samples analyzed through NMR spectroscopy can be found in the KBI Member Forum